This preliminary study highlights that Darwin’s woodland habitat will be severely reduced to small isolated patches by 2030-40, resulting in further declines to the city’s biodiversity value. The study is set out in five sections and based on May 2023 data:
- Introduction
- Future Land Use
- Woodland assessment
- Discussion
- Key findings and recommendations
1. Introduction
The tropical savanna woodland (hereafter referred to as woodland), and the diverse wildlife it supports, helps make Darwin a special place for residents and visitors. Many of the animal and bird species found around Darwin rely on tree hollows for shelter or nesting. The oldest and largest trees of the woodland provide the highest number and range of hollow sizes (see tree hollows) as they have experienced a long life where branches are broken by storms or burned by fire, exposing limbs hollowed out by termites. Unfortunately, most of these large trees have been lost through clearing during the development of Darwin, resulting in large declines in the abundance of the wildlife requiring this important habitat.
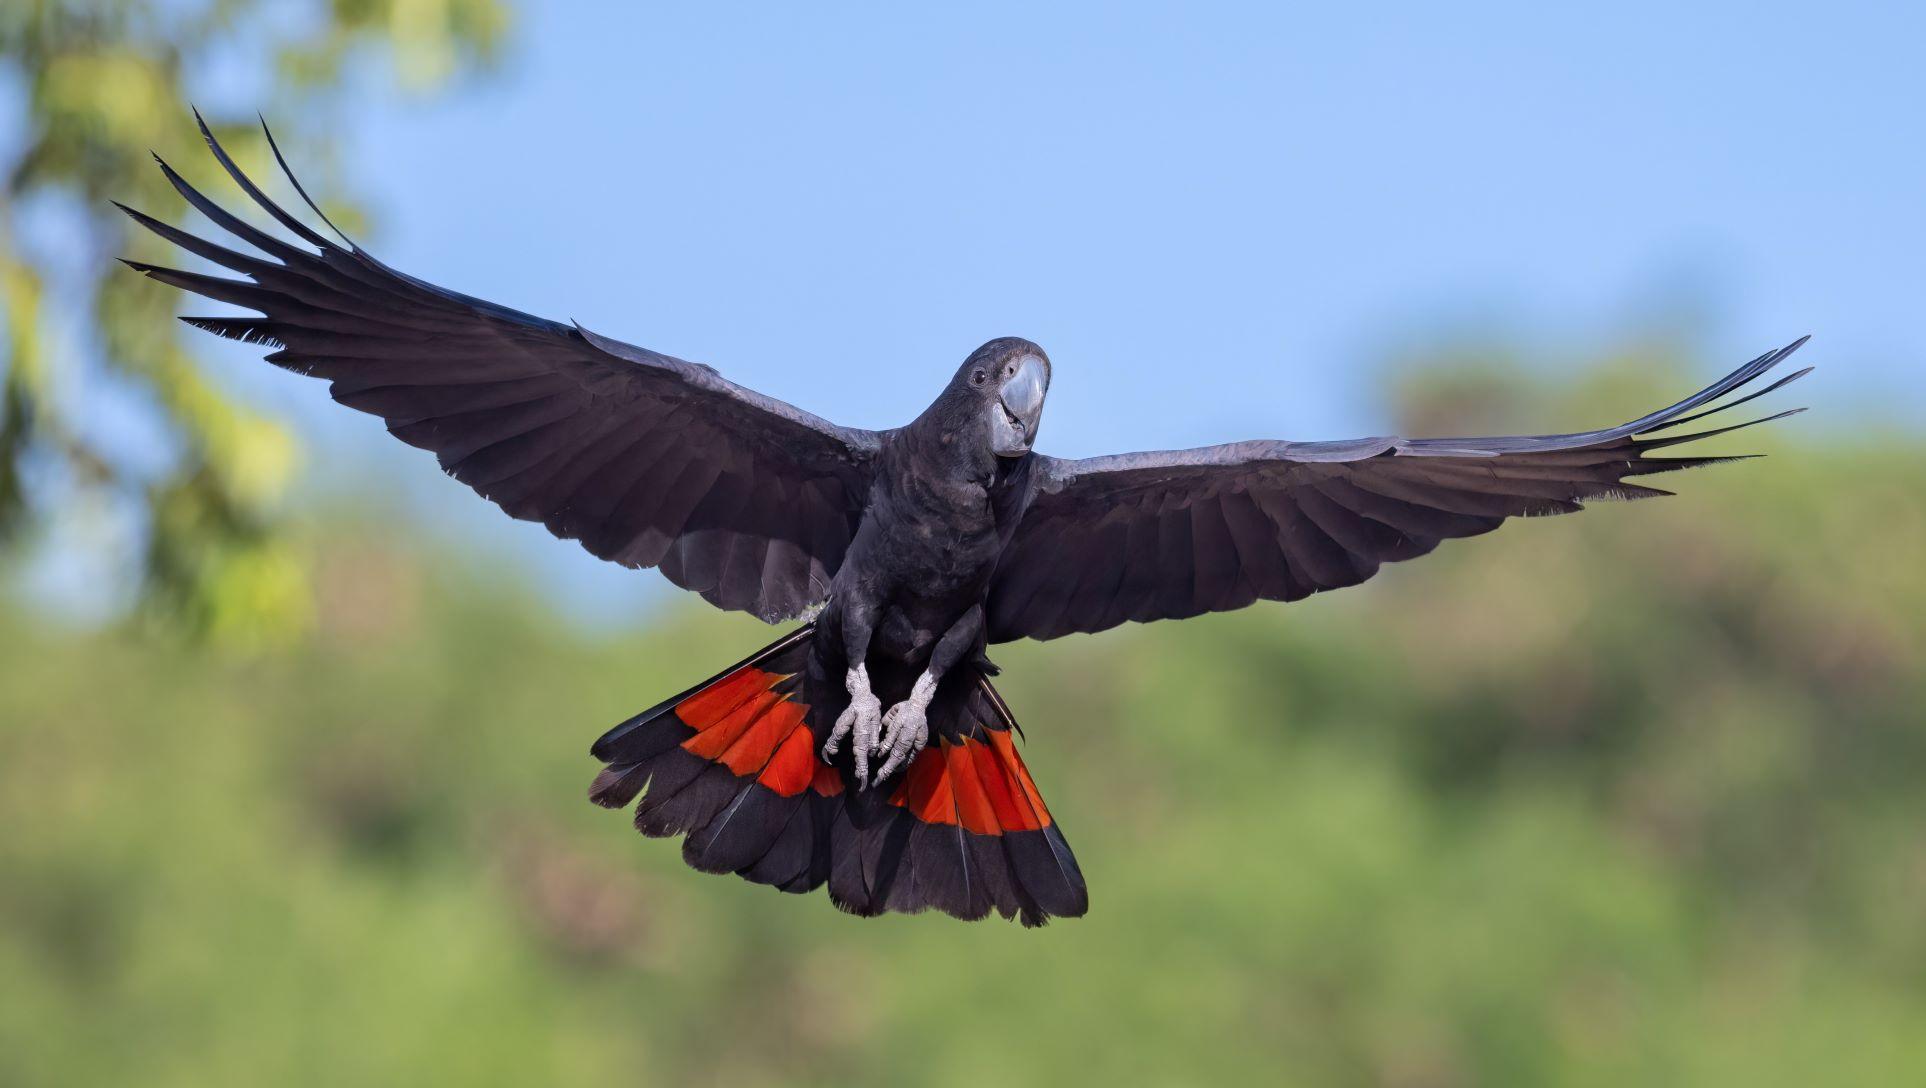
Fig 1. The Red-tailed Black-cockatoo is one of the species that live in the Darwin area and rely on tree hollows.
This report presents the preliminary findings of a study undertaken by Friends of Lee Point investigating the current and future state of Darwin’s savanna woodland containing important mature trees with hollows.
Approach – Current woodland assessment
Darwin’s woodland (Figure 1) consists mainly of Darwin Stringybarks (Eucalyptus tetradonta) and Darwin Woollybutts (Eucalyptus miniata), with Bloodwoods (Corymbia spp.) which tend to be in the lower, wetter areas. These woodland stands with mature, large trees generally occur on elevations greater than 14 m above mean sea level (MSL), which reflects the rise in landform from the low dunes and mangrove habitats.
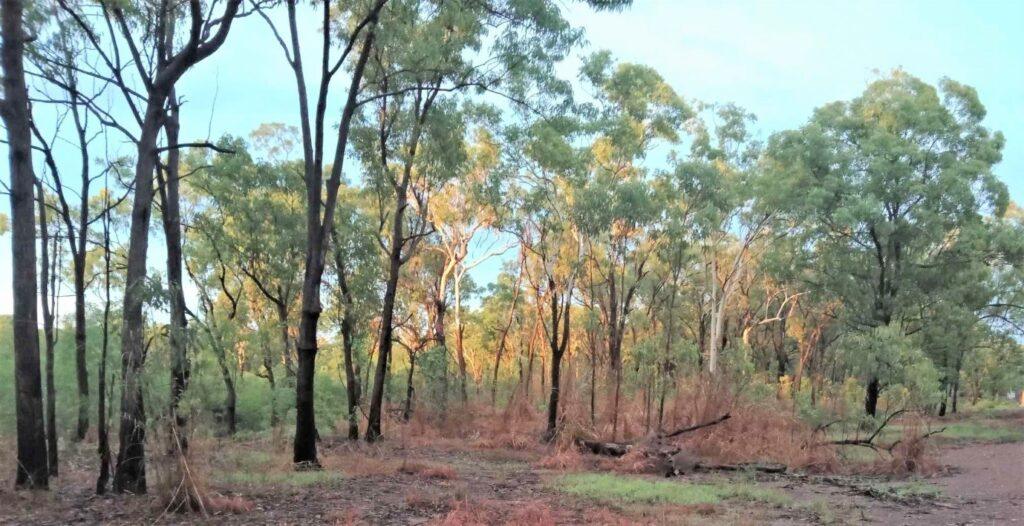
Figure 1. A native mix-species stand of large Darwin Stringybarks, Darwin Woollybutts and Bloodwoods at Lee Point.
Previous scientific research (see tree hollow abundance, and Woinarski and Westaway 2008) has found a significant relationship between hollow abundance and tree characteristics such as size and species, as well as other factors. The density per hectare of large trees meeting the criteria from this research was used in this study and we identify “large trees” any of the main species (E. miniata, E. tetradonta and Corymbia spp.) with a diameter of the trunk at breast height (DBH, 1.4 metres above ground level, in cm) of 35 cm or more. All other tree types were excluded. The location and abundance of large trees was determined by a targeted field survey.
All areas of natural woodland more than 14 metres above mean sea level were identified from satellite imagery (Google maps) and surveyed by foot or bike from Oct 2022 to Feb 2023. A mobile survey tool (Mergin Maps App) and QGIS was used to collect spatial data and map habitat quality for display in Google Maps.
The study area (see Figure 2. inside white line) was chosen to cover land in the Darwin and Palmerston local government area that was at least 14 metres above MSL. Over half the Territory’s population live in the study area, and travel time by car to Lee Point is less than 30 minutes.
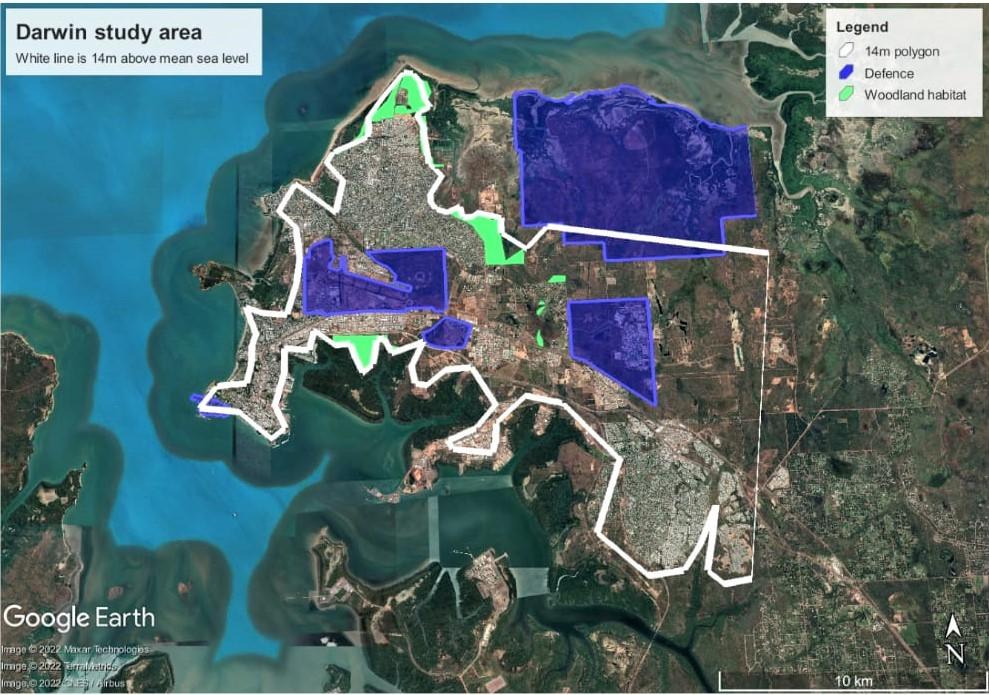
Figure 2. Darwin Study Area (187 sq km) – 14m above mean sea level with Defence Land shown in purple and woodland habitat in green.
In addition to locating individual trees, the various natural woodland habitats surveyed were rated for the quality of hollow providing habitat (i.e., the presence of large trees). Only parks or buffer areas that had or could support the selected large woodland trees were rated using the categories below:
-
- LOW: 0-2 large trees per hectare.
-
- MODERATE: 2-5 large trees per hectare and an area larger than 1ha (small isolated areas were ignored)
-
- HIGH: 5-10 large trees per hectare with evidence of hollows >5cm.
-
- VERY HIGH: >10 large trees per hectare with evidence of hollows >5cm.
2. Future land use
The NT Government’s Darwin Regional Land Use Plan guides land use in Darwin and shows areas intended for development. Figure 3 is an excerpt from this plan for Greenfield development with the current Defence Force bases added. It shows the future housing areas of Berrimah (2,000 houses), Holtz (1,500 houses) and Weddell (10,000 houses). These areas are typically 14 m above mean sea level and therefore cover the same elevation as the woodlands considered here.
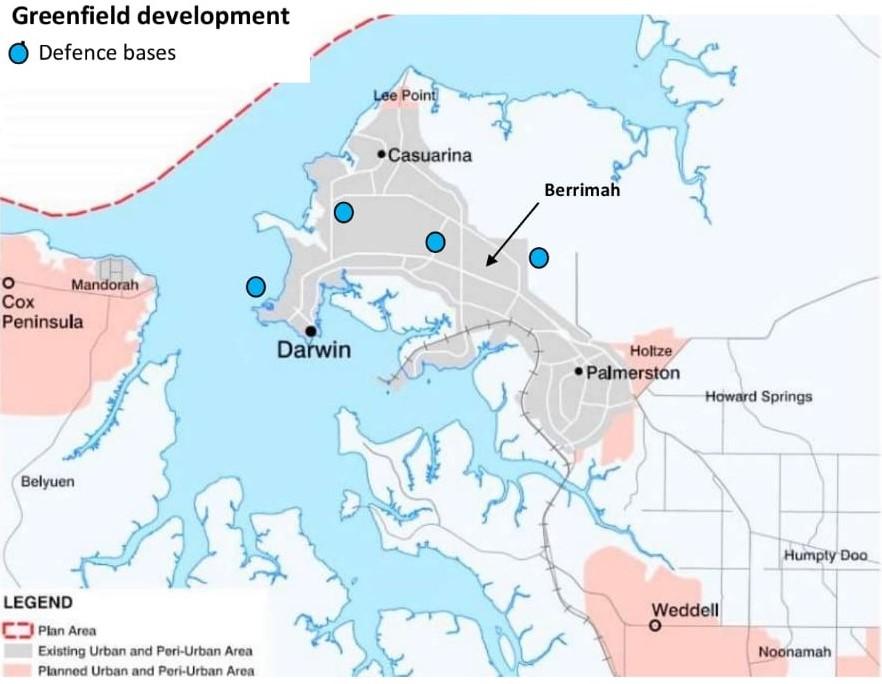
Figure 3. Darwin Regional Land Use Plan – Greenfield development with Defence Force bases added and showing the future residential developments.
Planning for Lee Point describes the benefits of housing defence personnel at Berrimah instead of Lee Point.
3. Woodland assessment
Most of the large trees (>=35cm DBH) observed were Darwin Stringybarks. In areas missing large trees, but with conditions expected to support mature woodland, these trees were generally less than 25 cm DBH. Given they are relying on wet season rains for water they are not expected to reach 35 cm DBH by 2040. The growth rate in native woodland is reported to be approximately 0.2cm DBH per annum based on this research . Woodland trees with access to water all year round ie. in a home garden, have a much higher growth rate.
A number of large trees of other native species were observed, but these have been excluded for the following reasons:
-
- Acacias, Melaleucas and other Eucalypts – very few hollows were observed in trees over 50 cm DBH, making tree hollows in these tree types uncommon.
- Northern Milkwood (Alstonia actinophylla) – no hollows were observed, and they are known to be termite resistant.
- Dead trees – only some of these trees are expected to exist by 2040 given the current fire regime and occurrence of storms.
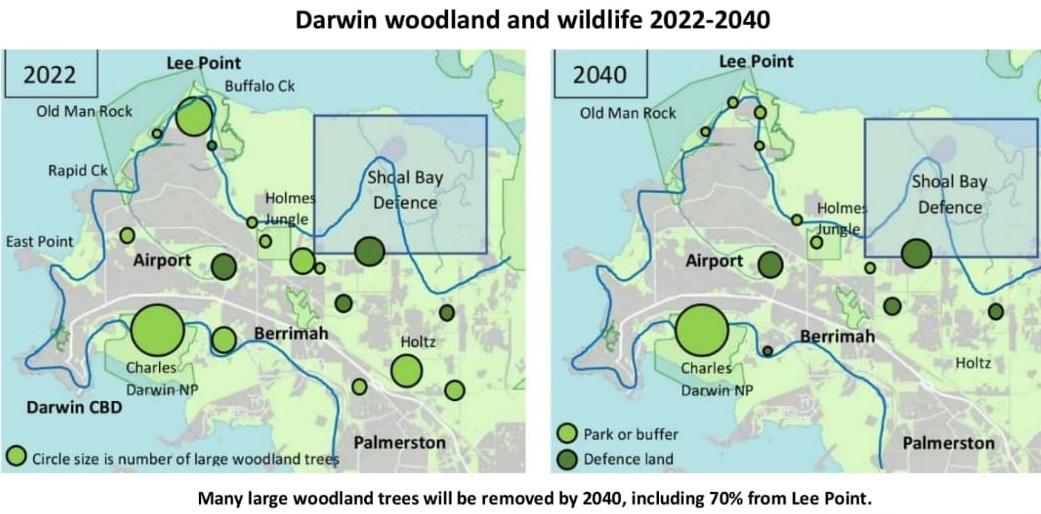
We estimate five square kilometres of woodland to be in parks and buffers, and these are assumed to be protected through to 2040 (Table 1). Other areas of native woodland have declined from an estimated 54 km2 in 2006 to 36 km2 today, and unless specifically protected there is no reason to suggest these will be present in 2040 based on the current land use plan.
Table 1. Historic (2006), current (2022) and predicted future (2040) Darwin woodland habitat area (km2)
|
|
Year 2006 |
Year 2022 |
Year 2040 |
|
|
sq km |
sq km |
sq km |
Parks and buffers (see Table 2 – does not include Lee Point) |
5.3 |
5.3 |
5.3 |
Native woodland (see note 1) |
38.2 |
20.6 |
1.8 |
Defence woodland (see note 2) |
10.5 |
10.5 |
10.5 |
Total (study area is 187 sq km) |
54.0 |
36.4 |
17.6 |
Note 1. In 16 years (2006 to 2022) Darwin lost 17.6 sq km of woodland, an average woodland loss rate of 1.1 sq km a year. At this rate Darwin will run out of unprotected native woodland by 2042.
Note 2. This estimate is mainly based on aerial photography. Defence woodland may also reduce by 2040.
The locations of woodland sites are provided in Figure 4 with the area of woodland classified in each of the rating levels provided in Table 2. The LOW rating relied on aerial photography plus general field observations while MODERATE, HIGH and VERY HIGH ratings were based on the field surveys and GPS-based spatial observations. Field-work load was reduced by only using selected main tree types with a minimum DBH of 35cm, ignoring isolated small areas <1ha with only a couple of large trees, and estimating the number of tree hollows (in place of a detailed assessment).
The majority of spatial survey records were identifying individual trees (with tree type, DBH and approx. number of hollows), while the remainder of GPS marks provided information to help define and rate the sites.
Most of the very large trees (>= 50 cm DBH) were located in HIGH and VERY HIGH areas in the Lee Point DHA project area and Charles Darwin National Park.
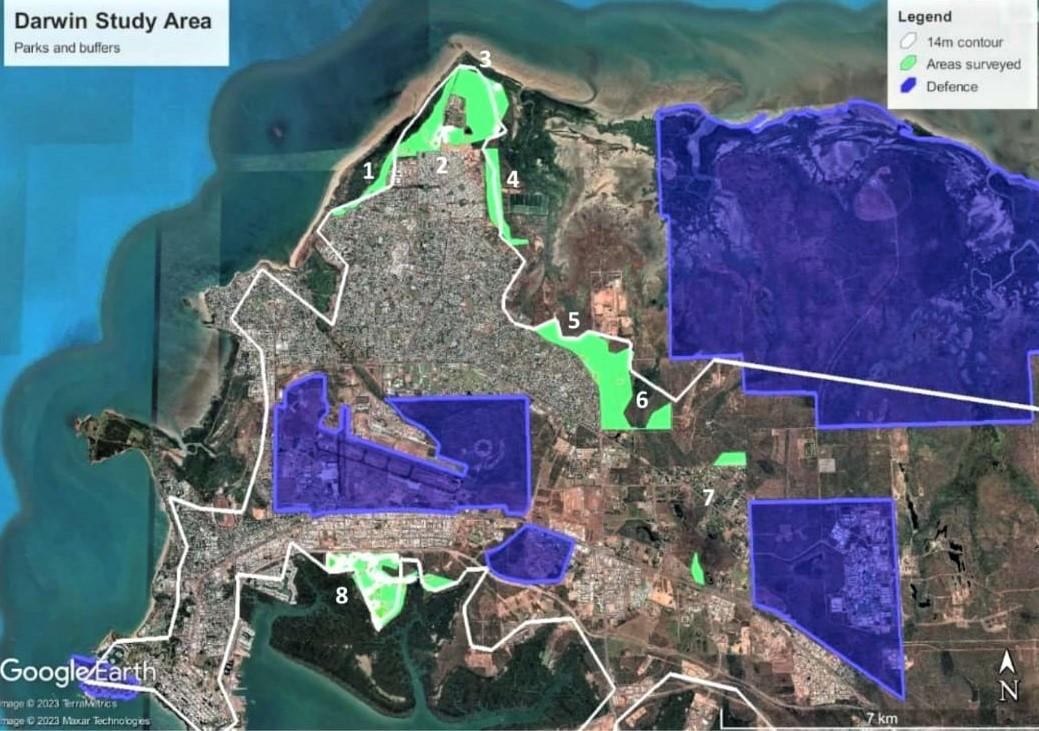
Figure 4. Location of parks and buffer sites that were rated (see Table 2) in May 2023
Table 2. The area (ha) and rating of woodland, refer Fig 4 for location (see note below).
Location of site |
LOW |
MOD |
HIGH |
VERY HIGH |
TOTAL |
Trees 35-50cm |
Trees >= 50cm |
Total large trees |
|
ha |
ha |
ha |
ha |
ha |
No. |
No. |
No. |
||
1 |
CCR (not in Lee Point) |
31 |
3 |
1.1 |
0.0 |
35 |
13 |
0 |
13 |
2 |
Lee Point – DHA Stg 2-8 and offset |
58 |
15 |
8.4 |
8.3 |
90 |
164 |
23 |
187 |
3 |
Lee Point – (outside DHA) |
136 |
7 |
3.6 |
2.2 |
149 |
46 |
21 |
67 |
4 |
Sewerage buffer |
61 |
9 |
1.0 |
0.0 |
71 |
5 |
2 |
7 |
5 |
Karama dump buffer |
90 |
8 |
3.5 |
0.0 |
101 |
20 |
3 |
23 |
6 |
Holmes Jungle |
79 |
40 |
1.1 |
0.0 |
120 |
22 |
6 |
28 |
7 |
Knuckey Lagoon Reserves- north |
14 |
3 |
1.7 |
0.0 |
19 |
31 |
1 |
32 |
Northern sites S/TOTAL |
469 |
85 |
20.4 |
10.5 |
585 |
301 |
56 |
357 |
|
|
|
|
|
|||||||
7 |
Knuckey Lagoon Reserves – south |
11 |
0 |
0 |
0 |
11 |
0 |
0 |
0 |
8 |
Charles Darwin NP |
48 |
67 |
33.3 |
29.7 |
178 |
688 |
98 |
786 |
TOTAL |
528 |
152 |
53.7 |
40.2 |
774 |
989 |
154 |
1143 |
|
Woodland locations in Table 2 were categorised into sites using the GPS records of 1143 large trees >= 35cm DBH plus field observations and aerial photography in May 2023.
Further field work to November 2023, much of it near Charles Darwin National Park, increased the number of large trees >= 35cm DBH (measured) from 1143 to 2369. However, this increase did not affect the findings/recommendations of this preliminary report and has not been included here.
Lee Point woodland, DHA development and offset area
This section provides results specific to Lee Point, the (130ha) DHA project area. A 21.5 ha offset area has been allocated within this area to compensate for the loss of the endangered Black-footed Tree-rat (Mesembriomys gouldii) habitat from planned clearing of stages 1-8. While Stage 1 included suitable habitat, it was cleared before this assessment and hence only Stages 2-8 were included here. Figure 5 shows areas of large tree densities rated LOW, MODERATE, HIGH and VERY HIGH at Lee Point and the flow of this habitat providing a corridor from Casuarina Coastal Reserve in the west to Buffalo Creek in the east.
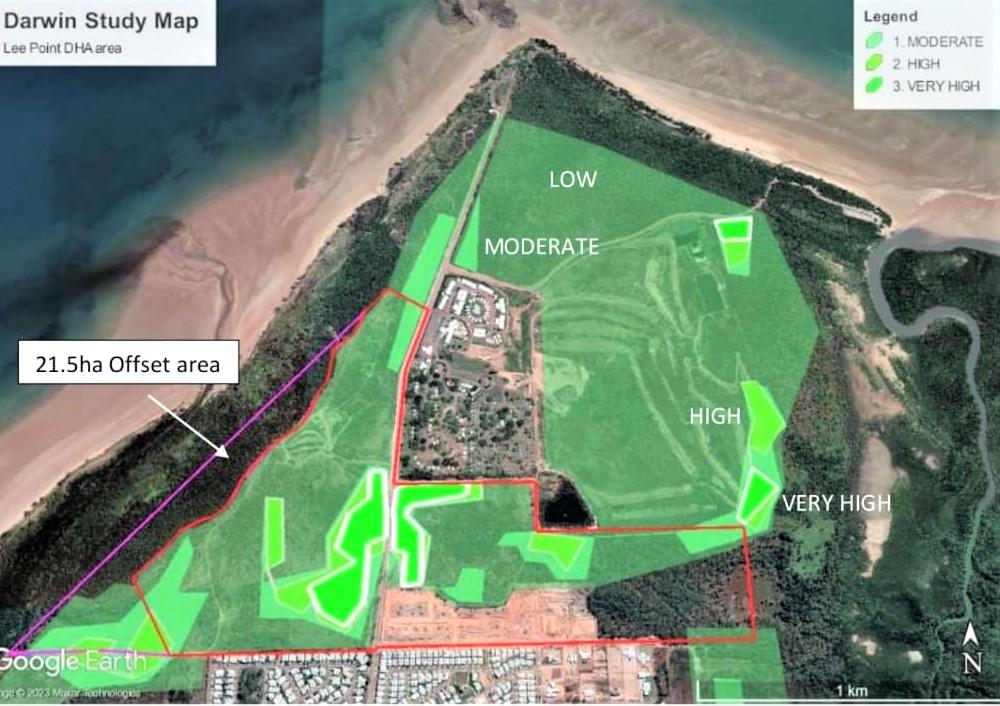
Figure 5. Woodland habitat rating for Lee Point. DHA offset area (purple) plus development area (red) makes up the DHA woodland site.
Table 3. DHA woodland site (includes woodland from the 21.5 ha offset area) and rated areas for large tree density. See locations in Figure 5.
|
|
LOW |
MOD |
HIGH |
VERY HIGH |
TOTAL |
|
|
ha |
ha |
ha |
ha |
ha |
A. DHA land with offset |
58.3 |
15.2 |
8.4 |
8.3 |
90.2 |
B. DHA offset |
2.8 |
2.4 |
1.4 |
0.0 |
6.6 |
Area lost (A-B) |
55.5 |
12.8 |
7.0 |
8.3 |
83.6 |
% of area retained or offset (B/A) |
5% |
16% |
16% |
0% |
7% |
Approximately 30% of the 21.5 ha offset area (6.6ha) is woodland habitat, the remainder being monsoon vine forest.
Woodland clearing and impact on Darwin’s wildlife
Based on research (Rankmore 2006) in Darwin’s rural area; the guideline (paraphrased here) for woodland clearing so that the vast majority of small mammals can survive is:
– a minimum woodland area of 20 sq km in a 50 sq km area (40%) needs to be kept. While this can be made up a series of patches (preferably larger than 10ha), the patches should be connected by a minimum of two corridors at least 100m wide and preferably have habitat the mammal can live in.
Currently the total woodland area for the northern sites (Sites 1-7, 12-14) is 19 sq km. Sites 12-14 are defence sites east of Site 7 (north).
The predicted impact of woodland clearing (as planned) on Darwin’s wildlife is shown below:
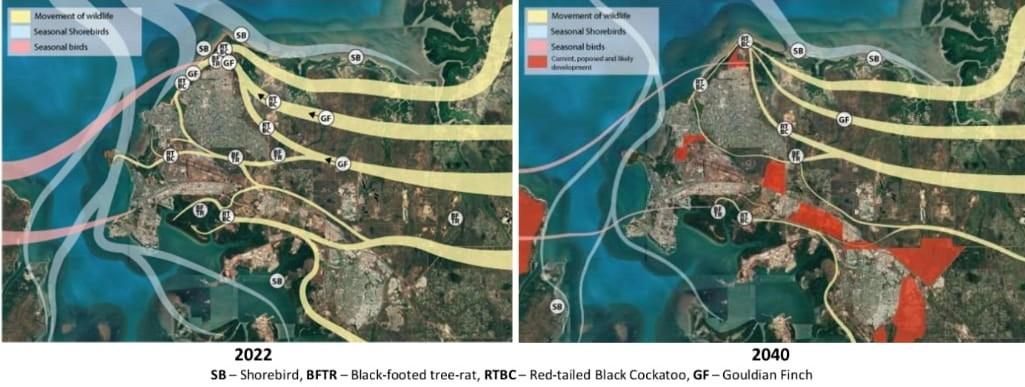
Charles Darwin NP and the southern sites will become increasingly isolated as time goes on.
4. Discussion
This study represents a preliminary assessment of the state of woodland containing large trees in the Darwin area. It shows that natural woodland stands providing hollows for wildlife are limited around Darwin/Palmerston with Lee Point providing some of the best woodland outside Charles Darwin National Park. We acknowledge several other woodlands, but these are on Defence land including the airport where any public access is restricted, and we were unable to undertake any detailed assessment of their quality and suitability.
This study relied on published scientific research for the relationship between tree DBH and likelihood of tree hollows (refer to Woinarski and Westaway 2008), and for growth rates for savanna tree species (reference to be added). Accepting these relationships meant that work could be focussed on locating/recording large tree areas.
Large trees (>=50 cm DBH) are important for providing large tree hollows for wildlife. Most of the trees >=50cm DBH occurred in the HIGH and VERY HIGH areas making these areas an absolute priority because of the significant large trees they contain.
Without considering the quality woodland lost through the clearing of Stage 1 (personal observations), the DHA project will destroy some of the best and last savanna woodland habitat in the Darwin and Palmerston local government area.
The proposed “21.5 ha offset” for the endangered Black-footed Tree-rat contains less than 7 hectares of woodland habitat and less than 4 hectares of woodland rated MODERATE or better. In essence, the DHA project blocks the corridor making access to the offset area much more difficult for the Black-footed tree-rat (an area it had access to anyway). The DHA project area only retains (thru an offset) 7% of the woodland and 8% of the HIGH and VERY HIGH areas for this small mammal, suggesting the offset is not fit for purpose in conserving this endangered species.
Charles Darwin National Park is expected to become more isolated for small mammals with any wildlife corridor ceasing to exist by 2040. The identification of large trees on Lee Point and subsequent rating of woodland habitat clearly identifies a corridor of highly valuable habitat linking Casuarina Coastal Reserve to Buffalo Creek and beyond supporting wildlife in the northern suburbs. This corridor includes the Lee Point Dam and may explain why this dam is so utilised by a wide variety of species including the Gouldian Finch.
Regardless of the Darwin Land Use planning map, whether all land more than 14 m above MSL will be developed (causing habitat loss) by 2040 is open to speculation. More likely is that the current woodland areas for small land animals will become more and more fragmented resulting in a similar fate, a decline in numbers. Habitat loss and fragmentation are leading causes of biodiversity loss in urban areas. Without protection, it is highly unlikely that any valuable savanna woodland habitat will remain outside the parks and reserves by 2040 given the current rate of land clearing for development. This will have dramatic consequences for the wildlife that relies on this habitat and may have follow on impacts on Darwin’s biodiversity in general affecting the ecological value of the city for residents and the potential ecotourism market.
This study highlights the need for further research into the remaining woodland tree stands around Darwin and Friends of Lee Point encourage funding into further valuable ecological research, tree mapping and inventories, and improved fire and weed management for this internationally significant tropical savanna.
5. Key findings
-
- The number of large woodland trees in the Darwin study area (187 sq km) will be substantially reduced by 2040 and Charles Darwin National Park will become more isolated from the other woodlands for small mammals.
- The Lee Point corridor is expected to have a significant proportion of the remaining large woodland trees (and tree hollows) in Darwin by 2040 – assuming no further land clearing of the Lee Point corridor occurs.
- The DHA woodland site (includes woodland from the 21.5 ha offset area) contains 16.7 ha of woodland rated HIGH or VERY HIGH of which 1.4ha (8%) is being retained in the 21.5ha offset area for the Black-footed tree-rat.
- The DHA development will remove the majority of large woodland trees from Lee Point – removing hollows critical to the survival of the Black-footed tree-rat.
- The only viable wildlife corridor from the Darwin rural area that connects large woodland tree areas for small mammals is located north of Darwin’s northern suburbs, it runs from Casuarina Coastal Reserve thru Lee Point to Shoal Bay Coastal Reserve.
Recommendations
- Darwin’s last wildlife corridor: Casuarina Coastal Reserve – Lee Point – Shoal Bay Coastal Reserve be protected to conserve Darwin’s biodiversity.
- The Lee Point Biodiversity Corridor be protected to conserve high quality woodland habitat in Darwin’s last wildlife corridor.